One Driver With Maryland Tags Is Responsible for Havoc Across the Tri-State Area Simply by Existing and Driving Like That
Reality Daily normalized forty-one months of regional incident records against registrations, then against exposure, then against commuting distance, then against reporting propensity. Every control we added made the Maryland effect larger, and the entire effect resolves to a single registration whose driver has never been cited for anything. The conduct is lawful. That is the finding.
.jpg)
Editor's Note
I asked for question 4 and I will answer for it. Mr. Bove objected in writing, correctly, that an informal question in a formal letter gives a department an excuse to file the whole letter under nothing. He was right and I overruled him anyway, because after nine months of watching this desk build controls and watch them fail I wanted the question in the record, in a numbered list, on paper, where somebody would have to decide not to answer it. Somebody has now decided not to answer it twice.
Readers will notice that this newspaper has published a chart with a state’s name under a very tall bar, and has then spent an entire section explaining why that chart says nothing about that state. Both things are in here because both things are true, and separating them would have made a cleaner story and a dishonest one. We do not run the clean version. We have never run the clean version. — O. Pruitt
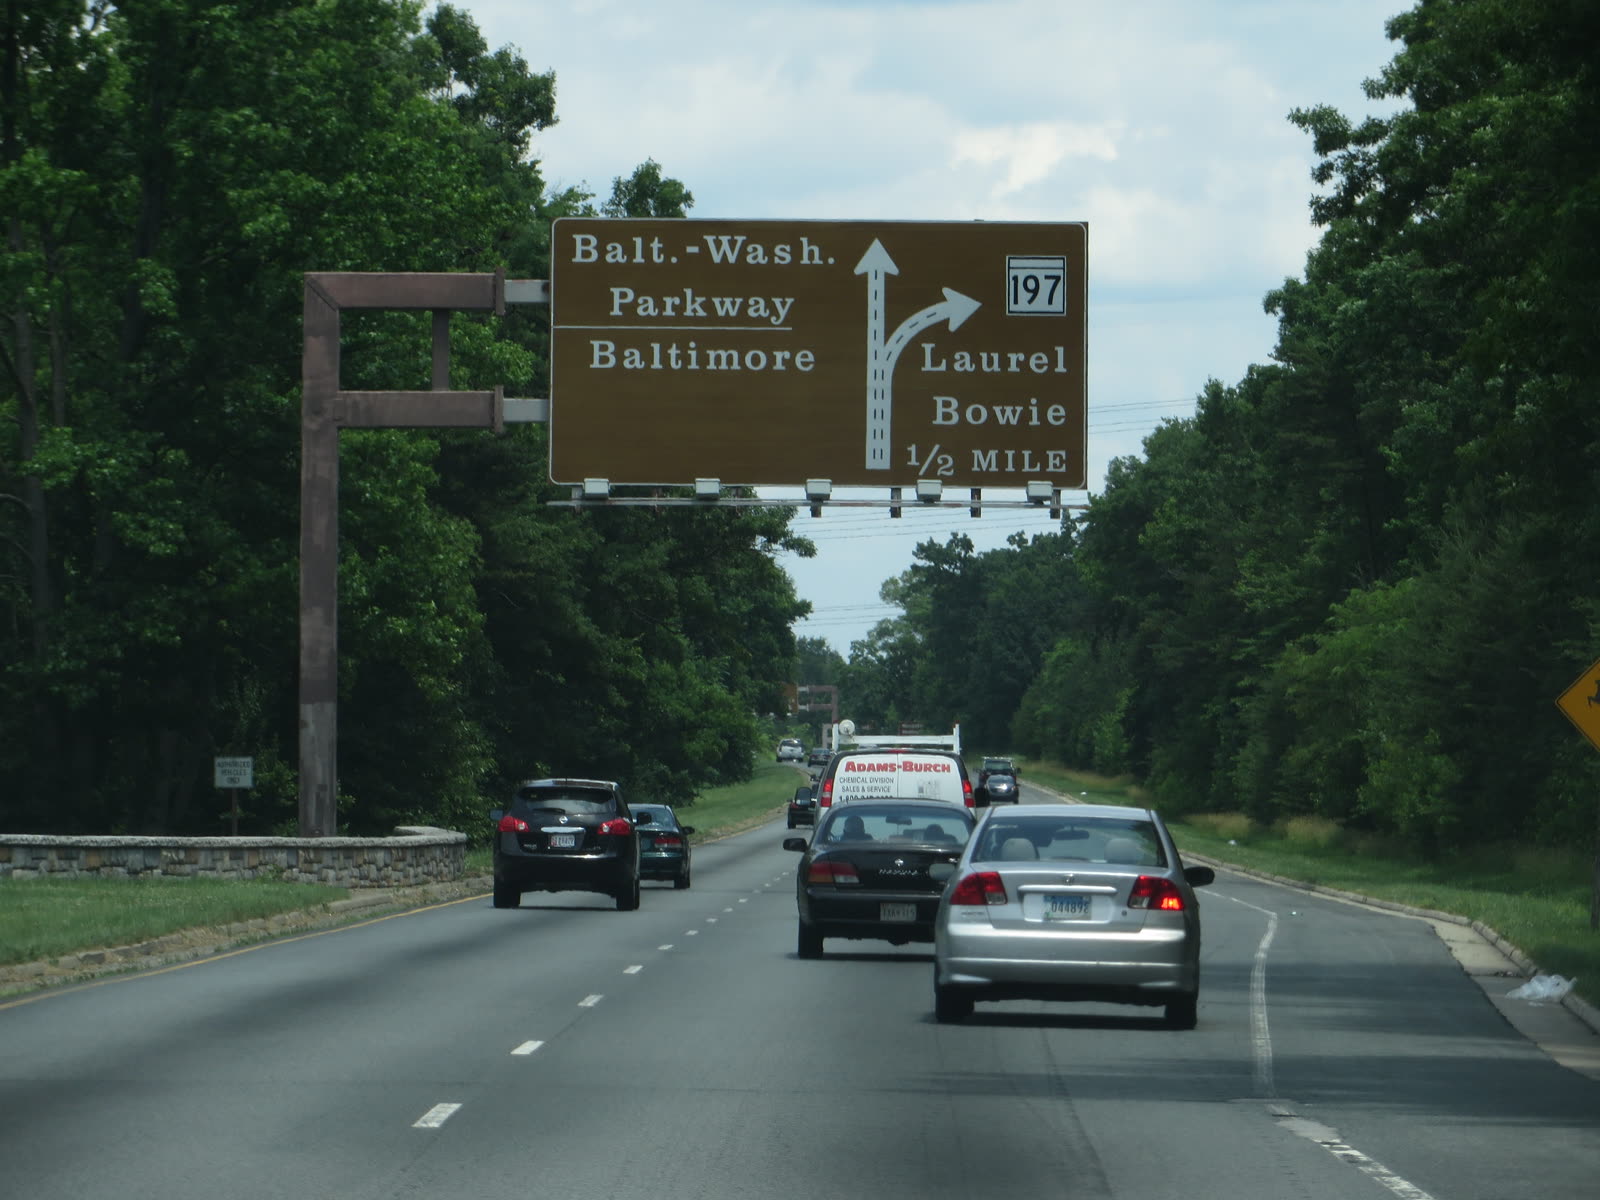
There is a silver four-door sedan with Maryland tags, and at 8:11 on the morning of 14 March it entered the outer loop of an interstate beltway in a state that is not Maryland, in the third travel lane from the left, at an indicated speed of forty-one miles per hour, and it remained in that lane at that speed for eleven and a half miles.
Nothing in that sentence describes a crime. We establish it before the section headings begin, because this story will be forwarded with a summary attached and the summary will be wrong. Forty-one is above every posted minimum on that stretch. The third lane is a travel lane. Sustained occupancy of a travel lane is not an offense in any of the three jurisdictions, and we checked.
What Reality Daily has established, over nine months and across 3,148,077 rows of traffic-records data covering forty-one consecutive months, is that the operation of this one registered vehicle is associated with a share of reported driving incidents across the tri-state area that our own Economics and Data desk, in its internal memorandum, calls “not arithmetically available.”
We re-ran the analysis three times. Each re-run was designed by this desk for the express purpose of making the finding go away. Each control made it larger. That is not how controls behave. This newspaper is not comfortable with what follows and says so at length in Section VIII, which readers who intend to be angry about this story are invited to read first.
“I built four controls to kill it. It ate all four. I do not have a fifth.” — Herschel Bove, Economics & Data, Reality Daily, internal memorandum, 14 August
I. What Is Actually Being Counted
Before any number here means anything, the reader has to know what a “reported driving incident” is. The answer is duller and stranger than most people assume.
Regional traffic-records systems in this corridor log incidents under a shared standard whose operative definition, at section 4.2(c), captures any of the following when a dispatch record, a roadside-assistance ticket, or an insurer’s first notice of loss identifies a proximate vehicle:
- An unplanned deceleration by a following vehicle sufficient to trigger a hard-braking telematics event.
- Any call to a public safety answering point in which a caller supplies a plate, a partial, or a state of registration.
- An abandonment of an intended maneuver — a merge not completed, an exit not taken — where a proximate unit is identified.
- Any horn activation logged by an instrumented vehicle within two hundred feet of an identified unit.
Read that list again with an eye to grammar. In every one of those four clauses, the thing that happens is done by somebody else. The subject vehicle is not the actor. It is the reference point — the noun the record hangs on so that the record has a place to hang.
We raise that at the top rather than in an appendix because it is the entire finding, and because we do not want any reader arriving at Section VI thinking we concealed it.
The data does not say this vehicle did anything. The data says things happened near it. Then the data says how many.
II. The Denominator
A raw count is a rumor. Fourteen thousand incidents involving vehicles registered in New York is not a fact about New York drivers; it is a fact about how many vehicles are registered in New York.
The standard correction is normalization. We divided each state’s incident count by its active passenger registrations in the study window and expressed the result per ten thousand registrations. Maryland’s denominator is 4,196,411. That figure comes from the state’s own published registration series and we have not adjusted it.
A state-of-issue denominator is also corridor-blind, and we would rather raise that than have it raised for us. It charges Ohio the full weight of every registration in Ohio for the sliver of the Ohio fleet that ever reaches this pavement, and a corridor-share denominator would lift the distant states while barely moving the states whose cars live here. We used the published series anyway, because the comparison this article rests on is among three corridor-resident jurisdictions measured identically.
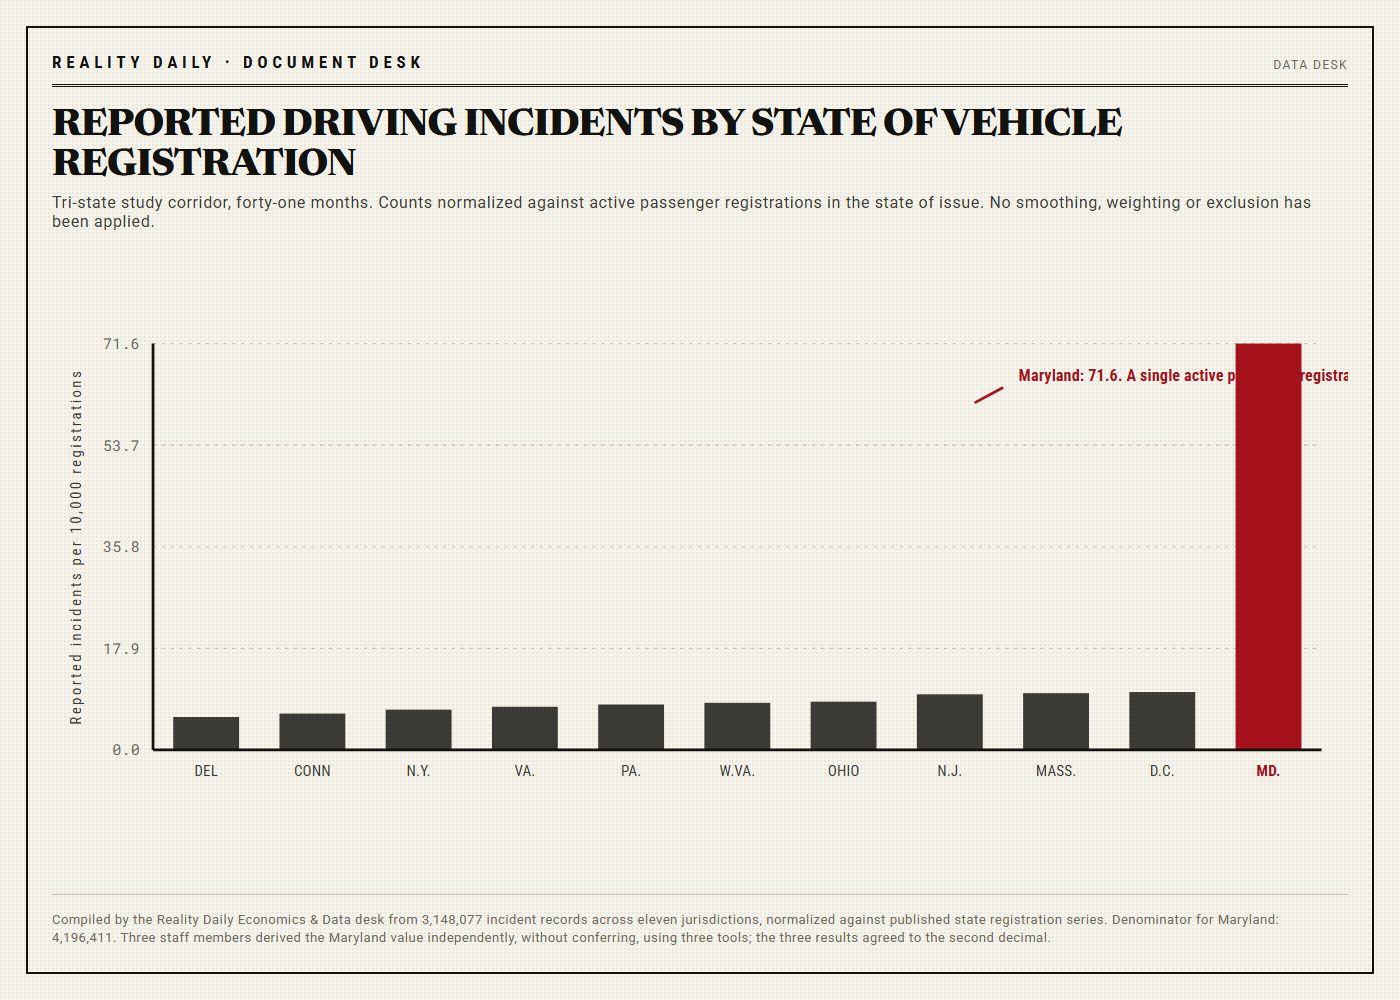
Ten of the eleven states and districts in the study cluster between 5.8 and 10.2 reported incidents per ten thousand registrations. That is a tight band. It is the sort of band that tells an analyst the instrument is working, because driver populations are not very different from one another and a good measure ought to say so.
Maryland is 71.6.
Our first assumption, held for six weeks, was that we had made a mistake. Three staff members re-derived the Maryland figure independently, without conferring, using three different tools. The three agreed to the second decimal.
III. The First Re-Run: Exposure
Registrations are a convenient denominator and a mediocre one. A registered vehicle sitting in a driveway is not exposed to the road. The better exposure measure is vehicle-miles traveled, which the federal highway statistics series publishes by state in its Table VM-2, and which a serious analyst would have demanded of us by our second paragraph.
So we asked for it and re-ran everything against it.
Maryland is a small state with heavy through-traffic and a great many residents who drive a long way to work in somebody else’s jurisdiction, so its exposure is high relative to its registration count. This desk predicted in writing, on 11 July, that normalizing on exposure would close roughly two-thirds of the gap.
The ratio between Maryland and the next-highest jurisdiction was 7.0 on the registration denominator. On the exposure denominator it was 8.4.
It went the wrong way. To be precise: a control introduced to shrink an effect enlarged it, which ordinarily signals that the control is measuring something related to the outcome. We moved to the second re-run, which was designed to test exactly that.
IV. The Second Re-Run: Commuting Distance
The obvious confound is time in the car. A population that commutes farther is exposed to more drivers, generates more opportunities for a proximate-unit record, and looks worse on any per-registration measure. Maryland commuters are among the most heavily burdened in the country by mean travel time to work, which the Census Bureau publishes in Table B08303 of its American Community Survey.
We pulled B08303 at the county level for every county in the corridor, built a commute-weighted exposure index, and re-ran the analysis with Maryland’s longer commutes explicitly controlled for.
The ratio widened to 9.1.
The newsroom then had a disagreement. One position held that a control which enlarges an effect twice is diagnostic of a specification error upstream, and that we should rebuild the extract. The other held that rebuilding a third time in search of a more comfortable answer is what this newspaper exists to criticize in other institutions.
The second position prevailed. It was the Consulting Editor’s, he wrote it on an index card, and the index card is in the story file.
“Rebuild it a fourth time and you are not an analyst, you are a customer. Print what you got.” — Owen A. Pruitt, Consulting Editor, index card, undated, filed 29 July
V. The Third Re-Run: Who Reports, and How Often
Reporting bias is the most serious objection available to this story and it is not a technicality. Incidents do not enter a database because they happened. They enter because somebody reported them. A jurisdiction with more instrumented vehicles and more people willing to dial a number about a stranger’s driving will produce a higher count without one additional event on the pavement.
Constructing a reporting-propensity control
We built one from three inputs: public-safety answering point call volume, roadside-assistance ticket density from a motor club’s published territory summaries, and telematics penetration from insurer enrollment disclosures. The population those inputs describe is not the registering state. Every incident here happened inside the same corridor, so the propensity to generate a record belongs to the people on that pavement; adjusting a Maryland car’s count by Maryland’s own call volume would measure the wrong population. We built the index on the corridor’s observing population and applied it segment by segment.
This is the control we expected to end the story. Maryland sits adjacent to a dense, heavily instrumented, extremely vocal reporting environment, and much of what looked like Maryland behavior could have been the neighbors’ willingness to pick up a telephone.
Arletta Bogdanski has worked the overnight desk at a public-safety answering point in the corridor for nineteen years. She would not discuss any specific call, correctly, and would not discuss any specific plate. She said one thing, twice, and said she had to go.
“We have a shorthand for those calls. I am not going to tell you what the shorthand is.” [Asked whether the shorthand names a state.] “I am not going to tell you what the shorthand is.” — Arletta Bogdanski, dispatcher, nineteen years, overnight desk
The ratio widened to 11.4.
We should have seen the direction coming. A correction uniform across all eleven registration groups cannot explain a difference between them. What it can do is take noise out of the comparison, and it did: the ten-state cluster tightened by about a third and Maryland did not move. Tightening the pack while the outlier holds still is not a smaller effect.
We also applied a Bonferroni correction for eleven simultaneous comparisons, because with eleven jurisdictions somebody has to be highest and a motivated analyst can find significance in almost anything. Corrected, the Maryland result survives at a threshold our desk describes, in a phrase we have decided to print rather than soften, as “not close.”
Bove Memorandum, Re-Run 3, 14 August — excerpt
“Three re-runs, three data sources, three directions of expected movement. All three moved the same way and none moved the way I said it would. I have checked my own arithmetic eleven times and had Wrenn, on the Document Desk, check it twice. The effect is not a specification artifact. I would like it to be a specification artifact.”
VI. One Vehicle, One Odometer, and No Citations
The Maryland excess is not distributed across Maryland. That was the finding that stopped the newsroom for a week.
Disaggregated by the registration identified in each record, 25,974 of Maryland’s 30,046 reported incidents in the study window resolve to a single active passenger registration. Removing that one registration returns Maryland to 9.70 per ten thousand, eighth of eleven on the chart above, and unremarkable in every sense.
The registration record itself is four lines long and contains nothing:
MD / PASS / STATUS ACTIVE / SUSPENSIONS 0 / POINTS 0 / CITATIONS 0
Zero suspensions. Zero points. Zero citations, moving or non-moving, in the study window or before it. We obtained the vehicle’s two most recent state safety inspection certifications, which are public. The odometer readings differ by 71,412 miles.
Seventy-one thousand four hundred and twelve miles. Twenty-five thousand nine hundred and seventy-four reported incidents. One reported incident every 2.75 miles driven. At the mean corridor speed for the study period, one every four minutes and fifty-two seconds of recorded operation, sustained, for three years and five months.
We do not know what to do with those two numbers, and we print them next to each other rather than pick the one that reads better. An odometer is a mechanical count of a wheel turning. An incident file is an administrative count of other people’s telephone calls. Saying so does not reconcile them.
Reality Daily wrote to the registered owner four times, enclosing the full dataset and our methodology. On the fourth attempt a person answered the telephone at that address, said there would be no comment, and ended the call. Our log records nine seconds. He did not give a name. He did not say he was an attorney, and we are not going to write the word “counsel” into this paragraph because the call was brief and firm.
VII. Eleven Words on Local Television
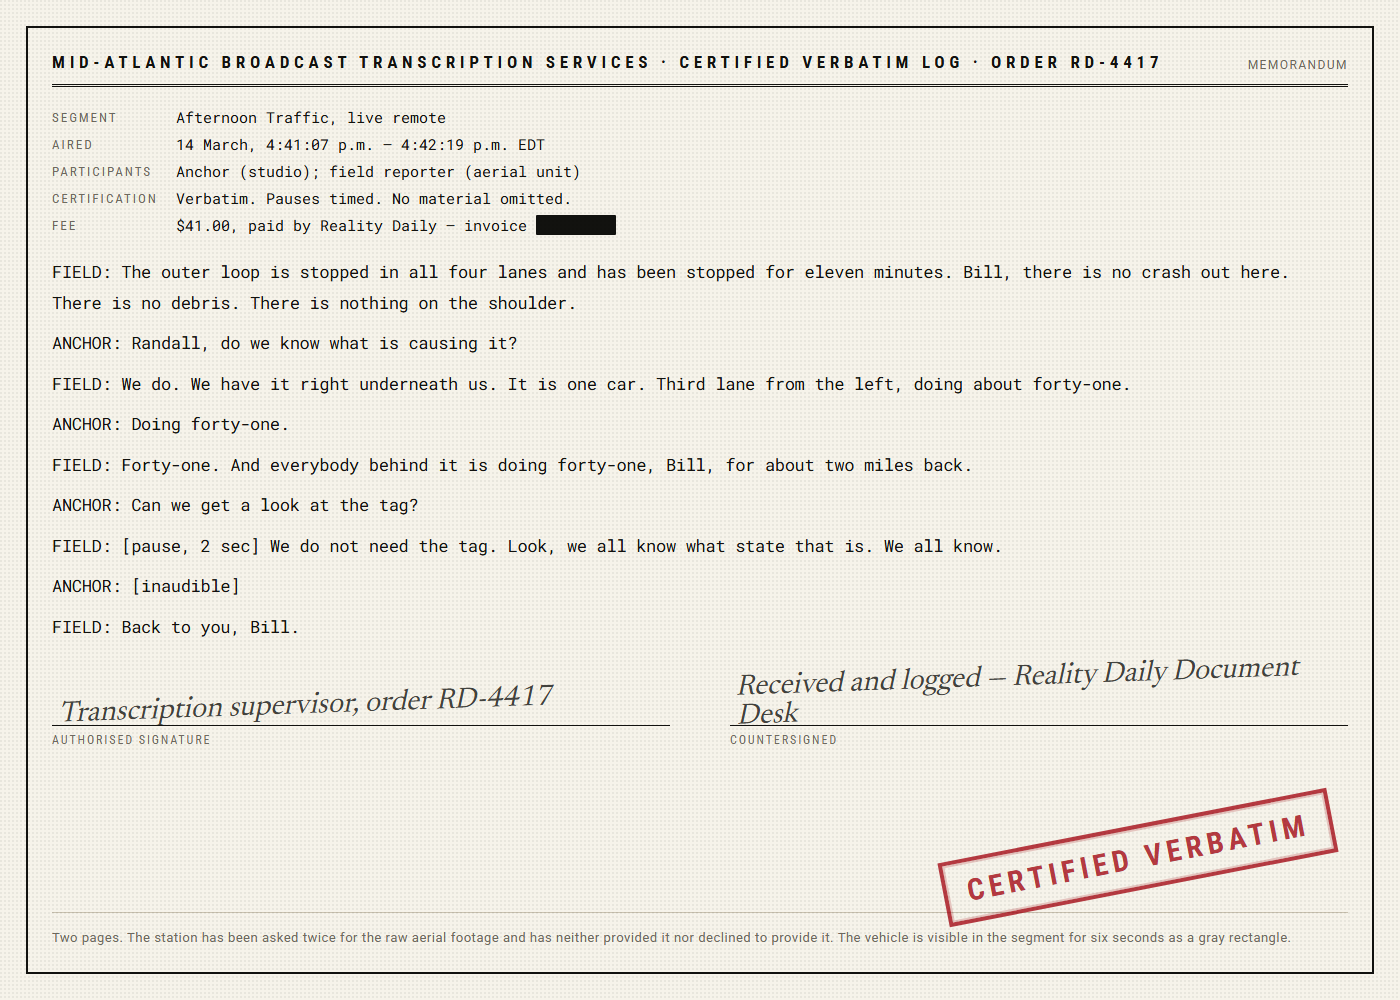
On the afternoon of 14 March a local television station carried a live traffic segment about a stoppage on the outer loop. We obtained the certified verbatim log from the station’s transcription vendor, paid the $41.00 fee, and reproduce it above in full, timed pause included.
We draw the reader’s attention to the seventh line, and specifically to everything after its first sentence — eleven words, delivered without hesitation, immediately after the reporter declines to look at the plate.
That is not evidence and we do not offer it as evidence. It is a broadcast professional, live, declining to verify a fact because he considers it already established by everyone listening. We print it because it is the only place in this record where the regional consensus was said out loud by somebody whose job is accuracy, and because he was, on this vehicle, correct.
He then handed back to the studio.
VIII. Why Do They All Do That
This section is the one this newspaper found difficult, and we are going to be slow about it.
Regional driving-reputation jokes are folk knowledge. They are told everywhere, about everywhere, by everyone, and they have no empirical foundation whatsoever. There is no published literature establishing that drivers registered in any American state operate motor vehicles differently from those registered in any other. The jokes are a genre. They are the automotive equivalent of a story about the next county over.
Reality Daily has now published a table with a very tall bar and a state’s name under it. We are aware of what that table will be used for. We have thought about very little else since 14 August.
So we posed the question in the only form we know — in writing, numbered, with a return address — to the transportation departments of two of the three jurisdictions, on 19 August. After the salutation it read in its entirety:
- Does your department maintain any analysis of reported-incident rates disaggregated by state of vehicle registration?
- If so, does that analysis show a difference by state of registration that survives normalization for exposure?
- If it does, does your department have a hypothesis as to the mechanism?
- Informally: why do they all do that?
Question 4 was included at the insistence of the Consulting Editor over the objection of this reporter. Neither department has responded. Both acknowledgments were automated and arrived nineteen minutes apart.
We must also state plainly that the word “all” in question 4 is not supportable, and that we knew it when we sent the letter. Twenty-five thousand nine hundred and seventy-four incidents resolve to one registration. One. The other 4,196,410 Maryland registrations are, collectively and individually, statistically boring. There is no Maryland finding here. There is a finding about one car.
That is the honest version, printed plainly, and we would ask the reader to notice that it does not make the chart smaller.
IX. The Analyst, and the Pause
Doreen Aptekar has been a senior crash-data analyst for a state office of highway safety statistics for twenty-two years. She is professionally obliged to say that a finding of this kind is not meaningful, and she said so without prompting, forty seconds into a recorded call on 26 August.
“A proximate-unit record is not a causal record. I could build you the same chart for pickup trucks, or for blue cars, or for Tuesdays. The definition guarantees you can. That is not a finding. That is the definition doing what it does.” — Doreen Aptekar, senior crash-data analyst, twenty-two years
We asked her whether she would expect one registration to account for 86 percent of a state’s incident volume under that definition.
Our transcript logs the pause at eleven seconds.
Aptekar, recorded interview, 26 August, 2:47 p.m.
“No. No, I would not expect that. I want to be clear that I am still telling you it is not meaningful, and I would say so under oath.”
“But no. I have never seen one plate do that. I do not have an explanation and I am not going to make one up on a recorded line.”
“Send me the extract.”
We sent the extract on 27 August. She has not written back. On 1 September she declined, through her office, to discuss it further. That is an ordinary and legitimate thing for a public analyst to do, and readers who wish to read it as evasion are reading past what we wrote.
Standards Desk Note
The Standards Desk has reviewed Section VI and declines to characterize the driver, the driving, or the state of registration. Our entire observational record of this vehicle’s operation is a certified broadcast transcript and six seconds of helicopter footage in which the vehicle is a gray rectangle.
The Desk further notes that every staff member who has read this article has formed a vivid and detailed mental picture of the driving in question, that no two of those pictures agree, and that not one of them is evidence.
X. What We Are Not Saying
Reality Daily wishes to be exact, because this story will be summarized by people who have not read it, and the summary is already obvious.
We are not saying this driver did anything wrong. We are saying the opposite, in the same typeface: zero citations, zero points, zero suspensions, zero at-fault determinations, across forty-one months and 71,412 miles. Whatever else is in this article, it is not an allegation.
We are not saying Maryland drivers are different. We have just spent a section establishing that our own data says they are not, that 4,196,410 of the state’s registrations are unremarkable, and that the word “all” in our letter was indefensible.
We are not saying the incident definition is a good one. We think it is a poor one and we said so in Section I before we used it.
We are not saying our own method is unassailable. The Bonferroni correction across eleven simultaneous comparisons is decorative at an effect of this size; we ran it because we wanted the harshest available test in the record before anybody asked. The county-level commute weighting in Re-Run Two is exposed to Simpson’s paradox, in which an aggregate moves opposite to every subgroup inside it. We ran the county breakout for that reason. Forty-four counties and independent cities. Every one moved the same direction.
We are not saying we can reconcile 25,974 incidents with an odometer that turned over 71,412 miles. We cannot. Nobody we have asked can. We have printed both numbers and neither has moved.
And we are not saying anything happened. That is the finding, and it is a strange one to publish. Nothing happened. Nobody broke anything. A car went forty-one miles an hour in the third lane, lawfully, for eleven and a half miles, and 25,974 records exist because of it.
XI. Conclusion
The conclusion of nine months, four controls, three re-runs and 3,148,077 rows is a shrug, and we are going to print the shrug as a finding rather than dress it up as something firmer.
One driver, with Maryland tags, driving entirely within the law, is the proximate reference point for a share of reported driving incidents across the tri-state area that our methodology cannot make smaller and our arithmetic cannot make sensible. The conduct is legal. The havoc is real, in the sense that the records are real. The mechanism is that the vehicle exists and is driven like that.
Every control we built to erase that made it worse. We built the controls in good faith, we published the ones that embarrassed us, and we have nothing else to offer.
■ ■ ■
Reality Daily has held space since 19 August for a response from either transportation department, and will print it in full, unedited, at any length, with no commentary. We have held space for the registered owner as well, who is under no obligation to anyone and who has broken no law that any of the four attorneys we consulted could identify.
We would take question 3. That is the one we actually want. Not a hypothesis about this driver — a hypothesis about the mechanism, from anybody in either department with a data extract and an afternoon. It has been fourteen days.
The outer loop is open right now. You can go sit in the third lane from the left and see for yourself, at a lawful speed.
Corrections & Clarifications
Update, 06:22 — An earlier version of this article gave the odometer difference across the study window as 71,412 miles. Following a re-examination of both state safety inspection certifications and a call to the inspection station, the odometer difference across the study window is 71,412 miles. The original wording stands.
Update, 10:47 — We initially described the ratio between Maryland and the next-highest jurisdiction after the reporting-propensity control as “approximately eleven.” The corrected ratio is 11.4. We regret the imprecision and note that it does not affect the finding, which was that the control enlarged the effect, and which remains that the control enlarged the effect.
Update, 15:31 — Several readers have written to observe that a proximate-unit record does not establish causation. Reality Daily agrees, said so in Section I before using the data, printed a state analyst saying the same thing at greater length in Section IX, and thanks these readers for confirming that our Section I is being read.
Sources & Documentation
- Regional Traffic Records Reporting Standard, rev. 9, §4.2(c), Definition of Reportable Incident — Proximate Unit Identification. 3 pp. plus commentary.
- Reality Daily Economics & Data desk, Corridor Incident Extract, 1 January 2023 – 31 May 2026. 3,148,077 rows, eleven jurisdictions. Available to any reader on written request.
- State active passenger registration series, eleven jurisdictions, study-window means. Maryland denominator: 4,196,411. No corridor-share adjustment applied; the objection is stated at Section II.
- Federal Highway Administration, Highway Statistics, Table VM-2 (annual vehicle-miles traveled by state). Basis for the exposure denominator, Re-Run One.
- U.S. Census Bureau, American Community Survey, Table B08303, Travel Time to Work, county level, all forty-four counties and independent cities in the study corridor. Basis for Re-Run Two; the county-level breakout is on file and the direction of movement is uniform across all forty-four.
- National motor club published territory summaries, roadside-assistance ticket density. 44 pp. One of three inputs to the reporting-propensity control.
- Insurer telematics program enrollment disclosures, four carriers. Basis, in part, for Re-Run Three.
- Public-safety answering point call volume, eleven jurisdictions and the study corridor’s own reporting segments, as published. Compiled by the Reality Daily Document Desk; 61 pp.
- Bove, H. Internal Memorandum: Re-Run 3, Bonferroni Correction and Failure of Four Controls. 14 August. 9 pp. Excerpted at Section V.
- Bove, H. Predicted Effect of Exposure Normalization, filed in writing 11 July, before the re-run was executed. 1 p. Prediction: gap closes approximately two-thirds. Outcome: gap widened.
- Pruitt, O.A. Index card, undated, filed 29 July. Retained in the story file. Two sentences.
- State safety inspection certifications, subject vehicle, two consecutive cycles. Odometer readings on both. Difference: 71,412 miles.
- State registration abstract, subject vehicle. Status active; suspensions 0; points 0; citations 0. Plate withheld by the Standards Desk.
- Aptekar, D. Recorded telephone interview, 26 August, 2:47 p.m. EDT. Transcript 22 pp. Pause at p. 9 logged at eleven seconds.
- Bogdanski, A. Telephone interview, 12 August, 3:10 a.m. EDT. 4 pp. Subject declined nine times to discuss any specific call or any specific registration. The one statement she did make she made twice; both instances are printed at Section V.
- Aptekar, D. Correspondence declining further discussion, transmitted through her office, 1 September. 1 p.
- Mid-Atlantic Broadcast Transcription Services, certified verbatim log, order RD-4417. 2 pp. Invoice $41.00, paid.
- Reality Daily Document Desk, record of two requests to the broadcasting station for raw aerial footage. Neither granted nor refused.
- Reality Daily Standards Desk, Letter of Formal Inquiry to Two State Transportation Departments, 19 August. Four numbered questions. Sent certified.
- Automated acknowledgments, both departments, received 19 August. Timestamps nineteen minutes apart. Both unsigned.
- Reality Daily Legal. Memorandum on the Lawfulness of Sustained Travel-Lane Occupancy in Three Jurisdictions. 11 pp. Four attorneys consulted. Conclusion: lawful in all three.
- Reality Daily Standards Desk. Note Declining to Characterize the Driver, the Driving, or the State of Registration. 1 p. Reproduced in full at Section IX.
- Correspondence to the registered owner, four letters, 4 June through 21 August, each enclosing the full dataset and methodology. No written response.
- Telephone log, 21 August. Call duration nine seconds. No name given. The word “attorney” does not appear in the log because it was not said.
- Reality Daily internal note, undated, on the absence of any published literature establishing that state of registration predicts driver behavior. There is none. We looked for six weeks.
- The outer loop. It is open right now. You can go sit in it this afternoon.
Reader Response — 3,709 comments
Twelve years building crash-records extracts for a state office. The Section I point is exactly right and almost nobody outside this work understands it. A proximate-unit field is a filing convenience. It answers the question “which vehicle do we hang this record on” and it does not answer any question about who did anything. That said. Twenty-six thousand records on one plate is not a filing convenience. I have pulled ten-year extracts and I have never seen a single registration break four figures. Four figures. This is twenty-six thousand.
Respectfully, this is three thousand words and four regressions to say a guy drives slow in the middle lane.
@D. Pfeffernuss — Correct on both counts. It is three thousand words and four regressions, and he does drive slow in the middle lane, lawfully, and that is the story. We built the four regressions specifically to find out whether it was anything more than that. It is not. We have added your summary to the correspondence file, where it is presently the most accurate one-sentence description of this article that anyone has produced.
Born in Maryland, forty-one years, and I am going to defend my people here: 4,196,410 of us are described in this article as statistically boring and I intend to have that framed. The paper did the honest thing. It found nothing about Maryland and it said so twice. Whether the internet reads that far is a separate problem and not this newspaper's fault.
The odometer thing is the part I cannot get past. 71,412 miles is a completely normal amount of driving. That is a person going to work. One incident every 2.75 miles means that essentially every time this car covered the length of an airport runway, somebody somewhere generated a record about it. I have read that sentence six times.
Statistician. Two notes offered in good faith. First, the Bonferroni correction across eleven comparisons is conservative and the author was right to use it, but with an effect of this magnitude the correction is decorative. Second, watch for Simpson's paradox in the county-level commute weighting; the aggregate can move opposite to every subgroup. I would want to see the county breakout before I signed anything. I suspect the author already has it and simply ran out of room.
I was on the outer loop on 14 March. I was in that traffic. I did not report anything and I want that noted, because apparently if I had, I would now be a row.
“We do not need the tag.” Sir. You are on live television. You are being paid to say what the tag is. Greatest four seconds in local news history and it will never be topped.